
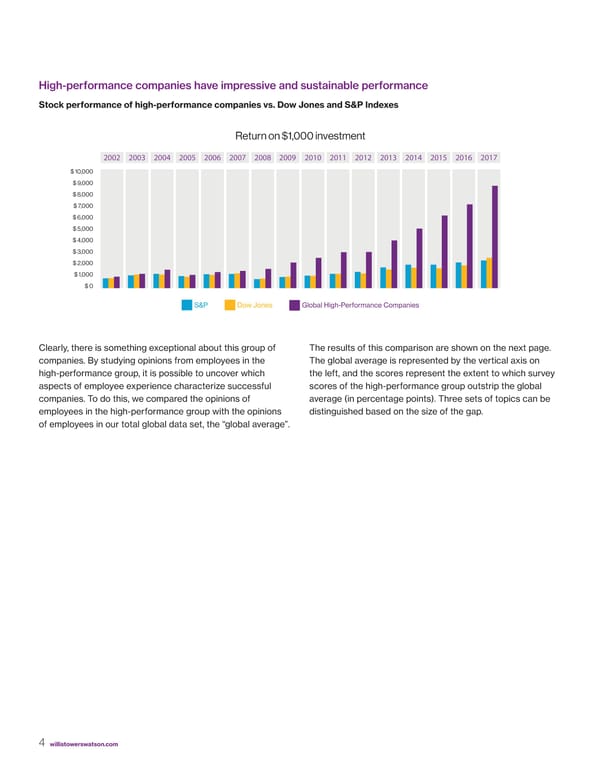
High-performance companies have impressive and sustainable performance Stock performance of high-performance companies vs. Dow Jones and S&P Indexes Return on $1,000 investment 2002 2003 2004 2005 2006 2007 2008 2009 2010 2011 2012 2013 2014 2015 2016 2017 $ 10,000 $ 9,000 $ 8,000 $ 7,000 $ 6,000 $ 5,000 $ 4,000 $ 3,000 $ 2,000 $ 1,000 $ 0 S&P Dow Jones Global High-Performance Companies Clearly, there is something exceptional about this group of The results of this comparison are shown on the next page. companies. By studying opinions from employees in the The global average is represented by the vertical axis on high-performance group, it is possible to uncover which the left, and the scores represent the extent to which survey aspects of employee experience characterize successful scores of the high-performance group outstrip the global companies. To do this, we compared the opinions of average (in percentage points). Three sets of topics can be employees in the high-performance group with the opinions distinguished based on the size of the gap. of employees in our total global data set, the “global average”. 4 willistowerswatson.com
 Breakthrough Research Page 3 Page 5