
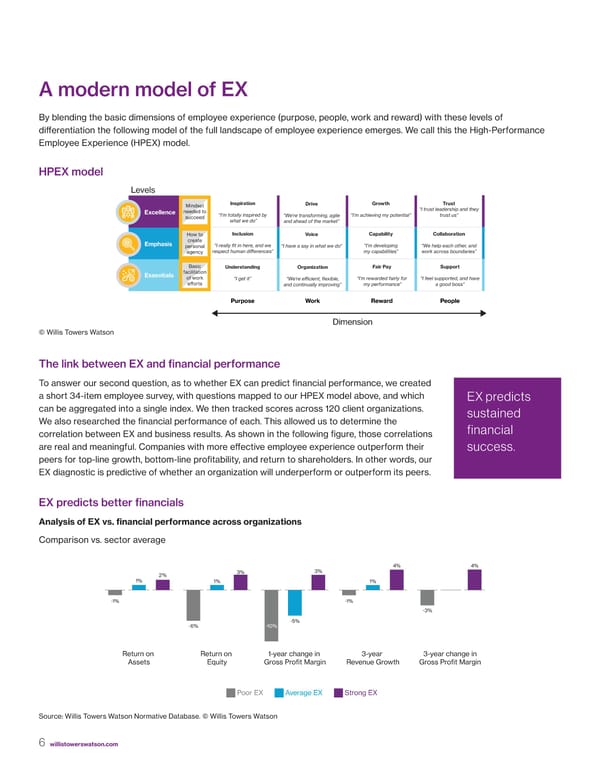
A modern model of EX By blending the basic dimensions of employee experience (purpose, people, work and reward) with these levels of differentiation the following model of the full landscape of employee experience emerges. We call this the High-Performance Employee Experience (HPEX) model. HPEX model Levels Mindset Inspiration Drive Growth Trust Excellence needed to “I trust leadership and they succeed “I’m totally inspired by “We’re transorming, agile “I’m achieing my potential” trust us” what we do” and ahead o the maret” How to Inclusion Voice Capability Collaboration Emphasis create personal “I really fit in here, and we “I hae a say in what we do” “I’m deeloping “We help each other, and agency respect human differences” my capabilities” wor across boundaries” Basic Understanding Organization Fair Pay Support Essentials facilitation of work “I get it” “We’re efficient, flexible, “I’m rewarded airly or “I eel supported, and hae efforts and continually improing” my perormance” a good boss” Purpose Work Reward People Dimension © Willis Towers Watson The link between EX and financial performance To answer our second question, as to whether EX can predict financial performance, we created a short 34-item employee survey, with questions mapped to our HPEX model above, and which EX predicts can be aggregated into a single index. We then tracked scores across 120 client organizations. sustained We also researched the financial performance of each. This allowed us to determine the financial correlation between EX and business results. As shown in the following figure, those correlations are real and meaningful. Companies with more effective employee experience outperform their success. peers for top-line growth, bottom-line profitability, and return to shareholders. In other words, our EX diagnostic is predictive of whether an organization will underperform or outperform its peers. EX predicts better financials Analysis of EX vs. financial performance across organizations Comparison vs. sector average 4% 4% 2% 3% 3% 1% 1% 1% -1% -1% -3% -5% -6% -10% Return on Return on 1-year change in 3-year 3-year change in Assets Equity Gross Profit Margin Revenue Growth Gross Profit Margin Poor EX Average EX Strong EX Source: Willis Towers Watson Normative Database. © Willis Towers Watson 6 willistowerswatson.com
 Breakthrough Research Page 5 Page 7